
Introducing Xlwings
In this final part of this tutorial series, we’ll go over how to make a basic yet functional front end for what we’ve created so far in this tutorial series. Typically when we refer to the front-end of our application we are referring to how a user interacts with the program we’ve written. A front end can take the form of a graphical user interface (GUI) which runs on a user’s own machine, or more commonly these days on a mobile platform (iPhone, android) or on a web site as a web application. For data science projects the web app is usually the optimal way to distribute your work out to the wider world. So If you’re looking to bee line to that step I’d suggest looking into Flask for the web development aspect and heroku for deployment.
But particularly in business situations, excel is probably the most common way people interact with data and it’s an uphill and not particularly necessary battle to get them to part from it. Excel is limited by the number of records it can reasonably process and by the functionalities programmed into it. What Excel has going for it, and what it excels at is user manipulation of data and representation. With the python library xlwings you can connect Python’s libraries and speed with Excel’s ready made user interface.
Xlwings bridges python and excel with two features: user defined functions which operate in a similar manner as excel functions but are written in python and the VBA RunPython module which invokes a python function from a VBA macro. For this tutorial we’ll create a simple yet effective analytics dashboard using xlwing’s RunPython function and what we’ve learned so far in this tutorial series. To start install xlwings with pip
pip install xlwings
Beyond just installing xlwings there’s a few additional steps that we need to take to get our environment up and running, so keep your terminal open. First let’s install the excel plugin for xlwings.
xlwings plugin install
if you encounter issues check this page of xlwings for troubleshooting the plugin installation. On this page the documentation suggests that we use another xlwings command to quickly spin up an xlwings project. Note the final argument of the command can be whatever you like, it just gives a name to your project, though I’d suggest making it sensible because unless you configure it otherwise later your scripts will need to conform to this naming convention.
xlwings quickstart quant_yourself_excel
After running this command you should find a folder named ‘quant_yourself_excel’ or whatever you called your project in the directory that you ran the command in. In that folder there should be an excel file and a python file both named ‘quant_yourself_excel’’ open up the python file with your text editor.
import xlwings as xw

def hello_xlwings():
    wb = xw.Book.caller()
    # sheets can be called via an integer value
    wb.sheets[0].range("A1").value = "Hello xlwings!"

@xw.func
def hello(name):
    return "hello {0}".format(name)
you should have see the above code already provided because we used xlwings quickstart. The first function is an example of a function activated by the VBA Module RunPython while the second function is an example of a user defined function. To start understanding what’s going on under the hood, open up the excel file as well.
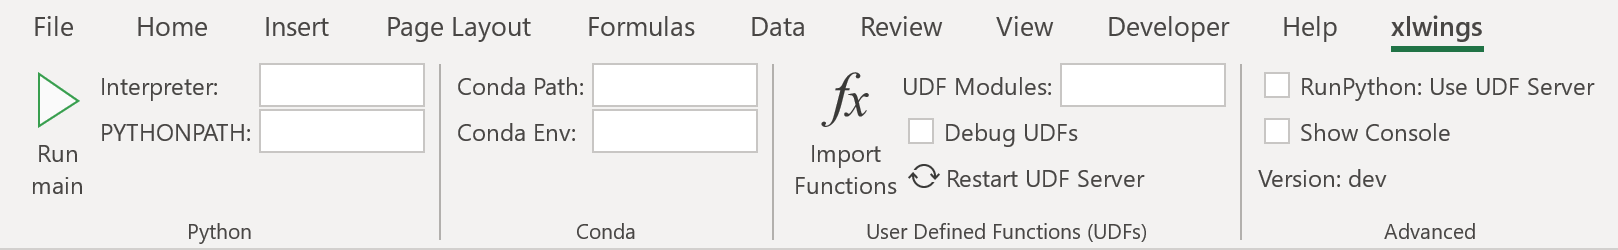
First verify that the bellow addition to your command ribbon is available, this will indicate that the plugin was installed properly.
Next open up the VBA editor from excel. Either from the Developer tab, find the Code panel, and click the Visual Basic button. On the Controls panel of the Developer tab, click View Code. If it’s not visible, click “File,” “Options” and then “Customize Ribbon.” Click the “Developer” check box within the Main Tabs list and click the “OK” button when you’re finished. You can also just use the keyboard shortcut ALT + F11 and on a mac the shortcut is Fn + ⌥ + F11
If you have other excel files open you may have to navigate around to find the pre-made xlwings macro but it most likely will be in sheet1 of this file. You should see a macro already filled out for you with the code bellow
Sub hello_xlwings()

    mymodule = Left(ThisWorkbook.name, (InStrRev(ThisWorkbook.name, ".", -1, vbTextCompare) - 1))

    RunPython ("import " & mymodule & "; " & mymodule & ".hello_xlwings(" & sFile & ")")

End Sub
We don’t have to worry too much about the specifics of this VBA macro, basically it’s already hard coded to find and then run our hello_xlwings() function in our python file. You can try it out by activating the hello_xlwings macro. Go back to your excel file and add a button to your excel sheet. To do so go back to the “developer” tab in the Controls group, click Insert, and then under Form Controls, click Button. Click on a location in the sheet where you want the button to appear. The Assign Macro popup window should appear. If it doesn’t, right click on the button and select “assing macro” from the drop down menu. Select hello_xlwings, and click “ok”. Now when you click on that button you should see “hello xlwings” in cell A1.
Go back to your python script and lets go line by line to see what happened.
wb = xw.Book.caller()
This tells xlwings to basically import the excel workbook that called the function, as an object into our python environment. You can think of the process as being similar to how we import our csv files into python with pandas. Both create an object that then gets stored in a variable. You can also tell xlwings which file to interact with directly by simply supplying it a file path like this.
wb = xw.Book('quant_yourself_excel.xlsm')
The next line gives us a basic idea of how xlwings will serve as our front end.
wb.sheets[0].range("A1").value = "Hello xlwings!"
The code above tells xlwings to select the first sheet in the workbook through an integer system, with the .sheets method. If you’d rather use the sheet name as it appears in the bottom tabs of your excel file you can supply those too as a string. After that the .range('A1') method call specifies an excel range using the same conventions that you’d use in excel. Finally to assign a value to an excel range you have to declare the .value attribute of our range, and this value is “Hello xlwings!”.
Importing our Data Set
We can import our data in same manner that we’ve done before using pd.read_csv in the same script our hello_xlwings function sits in. Open up your python file and create a new function like the following.
def main():
    wb = xw.Book.caller()
    filepath = 'Health Data.csv'
    df = pd.read_csv(filepath, parse_dates=['Start'])
    df = df.replace(np.int(0), np.nan)
    front_page = wb.sheets[0]
    font_page.range('A1').value = df.head()
Now open up the VB script in excel and add the following VBA macro, note that it can be in the same script as the SampleCall module like I do bellow.
Sub SampleCall()
    mymodule = Left(ThisWorkbook.Name, (InStrRev(ThisWorkbook.Name, ".", -1, vbTextCompare) - 1))
    RunPython ("import " & mymodule & ";" & mymodule & ".hello_xlwings()")
End Sub


Sub Analyze()
    mymodule = Left(ThisWorkbook.Name, (InStrRev(ThisWorkbook.Name, ".", -1, vbTextCompare) - 1))

    RunPython ("import " & mymodule & "; " & mymodule & ".main(" & sFile & ")")

End Sub
From here you can just call the Analyze macro or attach it to a button and you should see the top of your data set get outputted to your excel sheet.
Selecting an input file via GUI
For our purposes in this project having our main function read from a static filepath is likely sufficient but in my own work, since I often use xlwings to put python scripts into non-technical users hands, I wanted to share a little trick to get around having to set static filepath points with some vba. Open up your vba script and adjust your Analyze module with the following.
Sub Analyze()
    'FILE-SIDE PREPARATION
    'Returns file path string or boolean false
    vFile = Application.GetOpenFilename(Title:="Select File To Be Opened")

    'Error handling; easier to handle out of getWorkbook
    If vFile = False Then
        MsgBox ("Process Cancelled.")
        Exit Sub
    Else
        'replace / with // to avoid unicode decoding errors
        sFile = "'" & Replace(CStr(vFile), "\", "//") & "'"

    End If

    mymodule = Left(ThisWorkbook.Name, (InStrRev(ThisWorkbook.Name, ".", -1, vbTextCompare) - 1))

    RunPython ("import " & mymodule & "; " & mymodule & ".main(" & sFile & ")")

End Sub
The additional code above assigning mymodule tells vba to open up the standard file opening GUI that excel uses and then grabs the selected file and passes it into our main function at the bottom of the script. Back in our python script we need to adjust our python script accordingly.
def main(filepath):
    wb = xw.Book.caller()
    df = pd.read_csv(filepath, parse_dates=['Start'])
    df = df.replace(np.int(0), np.nan)
    front_page = wb.sheets[0]
    font_page.range('A1').value = df.head()
Now when you run your Anaylze macro it should open up a GUI and have you select a file, whose filepath then gets passed to python and the pandas read_csv function.
Handling user input
In the same way that xlwings can pass information from python to excel, it can also read information from our excel sheet and pass it into python. In the following additions to my python function I set up some date filtering input and then output some of the same kinds of analysis we did back in part 2 of this tutorial series.
import xlwings as xw
import pandas as pd
import seaborn as sns
from matplotlib import pyplot as plt
import numpy as np
from datetime import datetime as dt

def main(filepath):
    wb = xw.Book.caller()
    df = pd.read_csv(filepath, parse_dates=['Start'])
    df = df.replace(np.int(0), np.nan)
    front_page = wb.sheets[0]
    font_page.range('A1').value = df.head()
    # make sure python reads the excel page values as int for datetime
    upper_date = dt(day=int(front_page.range('E4').value),
                    month=int(front_page.range('F4').value),
                    year=int(front_page.range('G4').value))
    # except:
    #     upper_date = False
    try:
        lower_date = dt(day=int(front_page.range('E5').value),
                        month=int(front_page.range('F5').value),
                        year=int(front_page.range('G5').value))
    except:
        lower_date = False

    if upper_date:
        front_page.range('C7').value = f"upper bound date: {upper_date.strftime('%m/%d/%Y')}"
        df = df[df['Start'] <= upper_date]
    if lower_date:
        front_page.range('C8').value = f"upper bound date: {lower_date.strftime('%m/%d/%Y')}"
        df = df[df['Start'] >= lower_date]

    front_page.range('A8').value = "Statistics"
    front_page.range('A10').value = df.describe().T

    front_page.range('A22').value = 'Correlation Table'
    front_page.range('A23').value = df.corr()
As you can see above we can both assign and receive the values stored in .value when we call an xlwings range. With this functionality you can utilize python’s libraries and core functionalities in conjunction with Excel’s.
Adding color
Along with controlling the values on the excel sheet, xlwings can also control cell colors. I find this to be nice for highlighting information and giving the application some pizazz. At the end of the function I add the following for coloring our correlation table on the basis of their values.
    for col in ['C', 'D', 'E', 'F', 'G', 'H']:
        for i in range(24,31):
            try:
                if float(front_page.range(f"{col}{i}").value) > 0:
                    front_page.range(f"{col}{i}").color = (66, 244, 80)
                else:
                    front_page.range(f"{col}{i}").color = (255, 153, 153)
            except:
                pass
In the same way that our xlwings .range objects have a value attribute they also have a color attribute the value I’m assigning them are rgb values contained within () (this is a python tuple which is like a python list but can’t be changed after it’s created). In the above I’m simply having python loop through the excel columns and then the rows using python’s range function. The range function simply generates a set of numbers from its first parameter to the second. So in the above loop it just casts as i, the numbers 24,25, 26, … 31. These then get passed into a f-string along with the columns we are looping through with the col variable to produce strings like ‘C24’ and ‘F31’. If the nested for loops are confusing to you, try writing the same function in a seperate script without the calls to front_page and simply print out the col, i combinations.
Adding charts
The final piece xlwings functionality I’d like to demonstrate is the ability to pass charts into the excel sheet. First create a seaborn plot as we would do normally but instead store it in a variable with the .get_figure() method:
sns.set_style("darkgrid")
steps = df['Steps (count)'].dropna()
steps_fig = sns.distplot(steps).get_figure()
Then you can pass it to excel using the .pictures attribute of an xlwings sheet. See the following code, that I have after the graph creating code.
sns.set_style("darkgrid")
steps = df['Steps (count)'].dropna()
steps_fig = sns.distplot(steps).get_figure()
graphs_page = wb.sheets['Graphs']
graphs_page.range('A1:Z300').clear_contents()
try:
   graphs_page.pictures.add(steps_fig, name='step count distribution')
except:
   # if the graph already exists use this syntax
   graphs_page.pictures.add(steps_fig, update='step count distribution', name='step count distribution')
Wrap up
While eventually you’ll want to move to creating web based applications, in my experience xlwings can be a really effective tool for creating a simple and familiar user interface, it far less time than it would to create a GUI using tkinter or making a website with Flask or Django. It’s also an a great means of moving your existing work in excel to more automated and functional processes with Python. At least until Excel officially supports python along with it’s native VBA.